Introduction:
In classical computing, a digital “bit” is either a 0 or 1, but cannot be both at the same time. However, in Quantum Computing, a “qubit” (quantum bit) can be in a superposition (both at once) until measured, leading to probabilistic outcomes.
The above paragraph describes the phenomenon of superposition which will show non-deterministic results, matching Quantum predictions (a core Quantum phenomenon). I will demonstrate Quantum superposition through a Python simulation program with the corresponding outputs (one graphical plot and one console output) that will prove the Quantum Computing assertion.
Superposition:
In the Python program, I have used “QISKit” (Quantum Information Software Kit), which is an open-source, Python-based, high-performance software stack
for Quantum Computing, originally developed by IBM Research and first released in 2017.
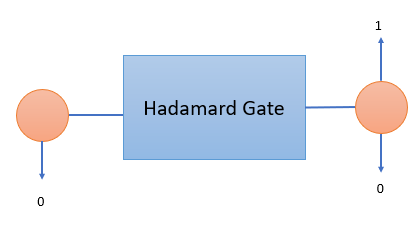 My Python program has a single qubit that is put into a superposition using the Hadamard Gate (pictured above). The same simulation program, when run several times, will result in 512 for each of ‘0’ and ‘1’ [as mentioned in Expected Results]. The Hadamard Gate creates (|0> + |1>)/√2 (“braket” notation – check https://www.mathsisfun.com/physics/bra-ket-notation.html for a simple explanation of what this implies), so measurements yield 0 and 1 with 50% probability for each of 0 and 1 — which is impossible in classical bits without the randomness that Quantum computing provides.
Real-Life Tie-In: This mirrors experiments on real Quantum hardware (e.g., IBM Quantum Platform through IBM Cloud), and can even run on actual qubits via the QISKit cloud access of IBM.
Limitations: For 1 or 2 qubits, simulation is exact. Beyond 20 or 30 qubits, it becomes infeasible in the classical sense, and Quantum computing resources will be needed.
Python Program: The program name is “QS” and can be accessed as a PDF file by clicking the link — QS
Expected Results
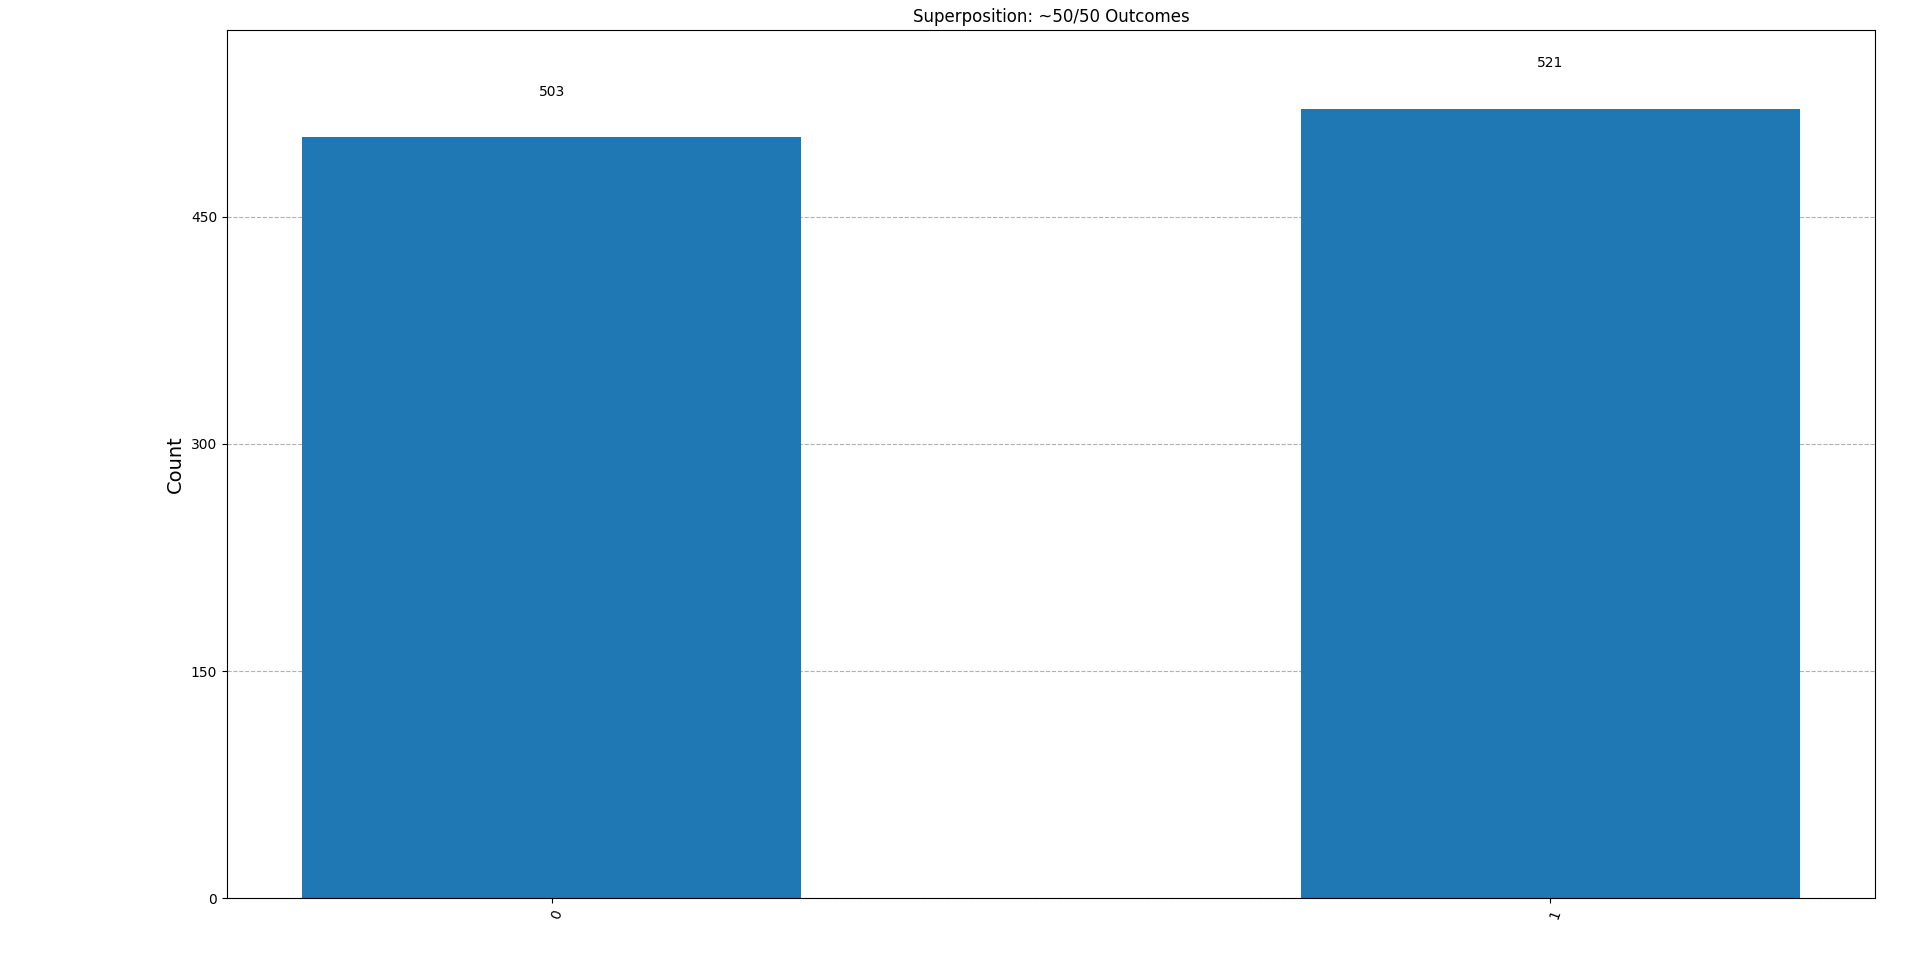
(1) Plot: A bar chart with ‘0’ and ‘1’ roughly equal (e.g., 503 for ‘0’ and 521 for ‘1’ in the case of just one simulation, consisting of of 1024 runs, as shown below – running the same simulation program several times will result in 512 for each of ‘0’ and ‘1’).
(2) Console: Measurement outcomes: {‘0’: 503, ‘1’: 521} – 503 for ‘0’ and 521 for ‘1’ in the case of just one run – running the same simulation program several times will result in 512 for each of ‘0’ and ‘1’ [as mentioned in (1)].